")
")

Color infrared
Color-infrared (CIR) imagery uses a portion of the electromagnetic spectrum known as near infrared that ranges from 0.70 μm to 1.0 μm (0.7 to 1.0 micrometers or millionths of a meter), just beyond the wavelengths for the color red.
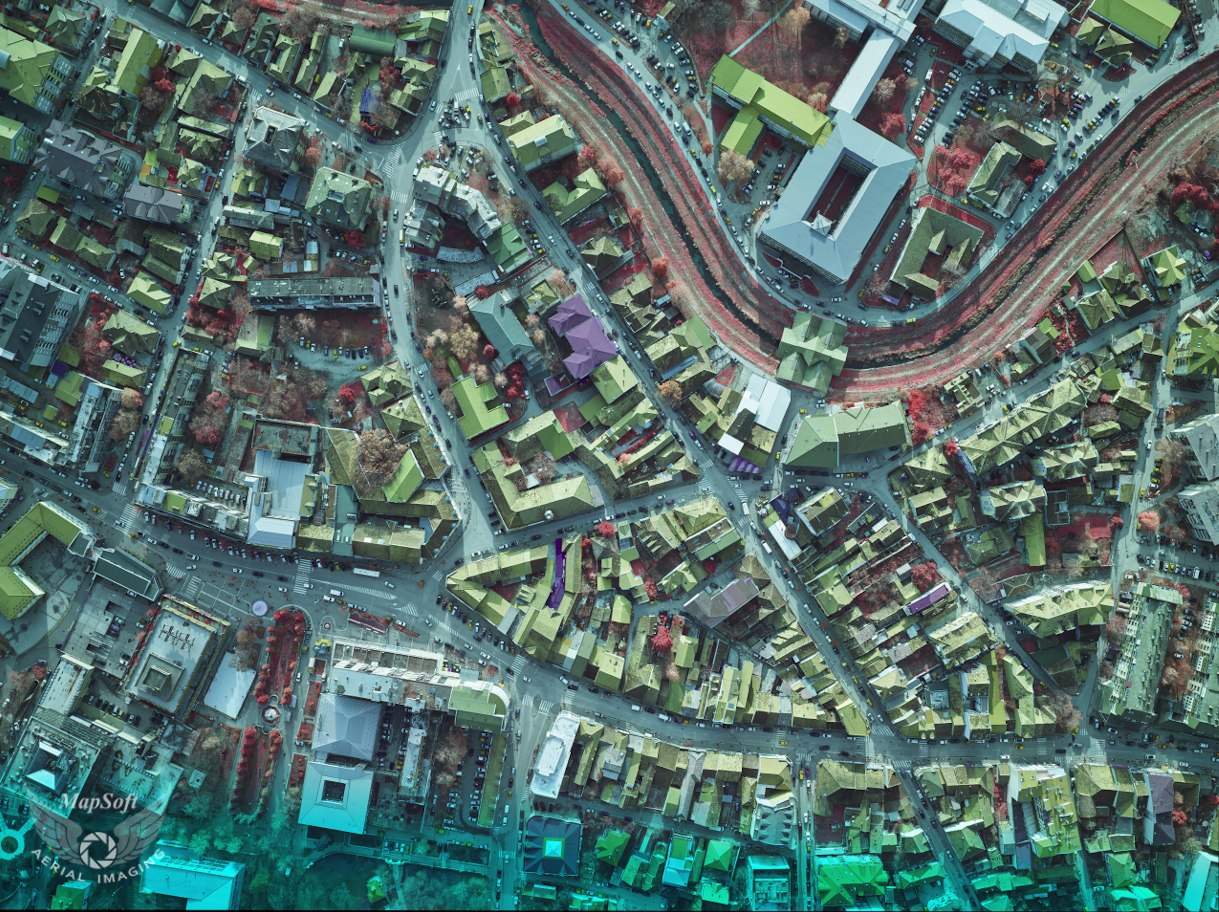
MapSoft sensor system is equipped with a metric RGB camera and metric NIR camera. 4 band (R+G+B+NIR) images are obtained as a result of aerial imaging.
There are millions of colors of visible light, yet each is simply a different combination of the three primary colors: blue, green and red. The invisible near infrared light of CIR can be "seen" by shifting it and the primary colors over as shown at left.
Near infrared wavelengths become visible as red while red wavelengths appear as green and green as blue. Blue wavelengths are shifted out of the visible portion of the spectrum and so they appear as black. On CIR imagery vegetation appears red while water generally appears black with artificial structures like buildings and roads showing as a light blue-green.
Color infrared is especially useful because the internal cell structure of healthy plants reflects near infrared wavelengths. Chlorophyll in plants reflects green wavelengths; this is why healthy plants appear green to humans. In addition, the reflected infrared is more reliable in monitoring plant health than the reflected green wavelengths.
CIR tends to penetrate atmospheric haze better than natural color, and it provides sharper imagery. This makes CIR especially valuable in areas of the country which are hot and humid in the summer.
Interpretation of CIR imagery
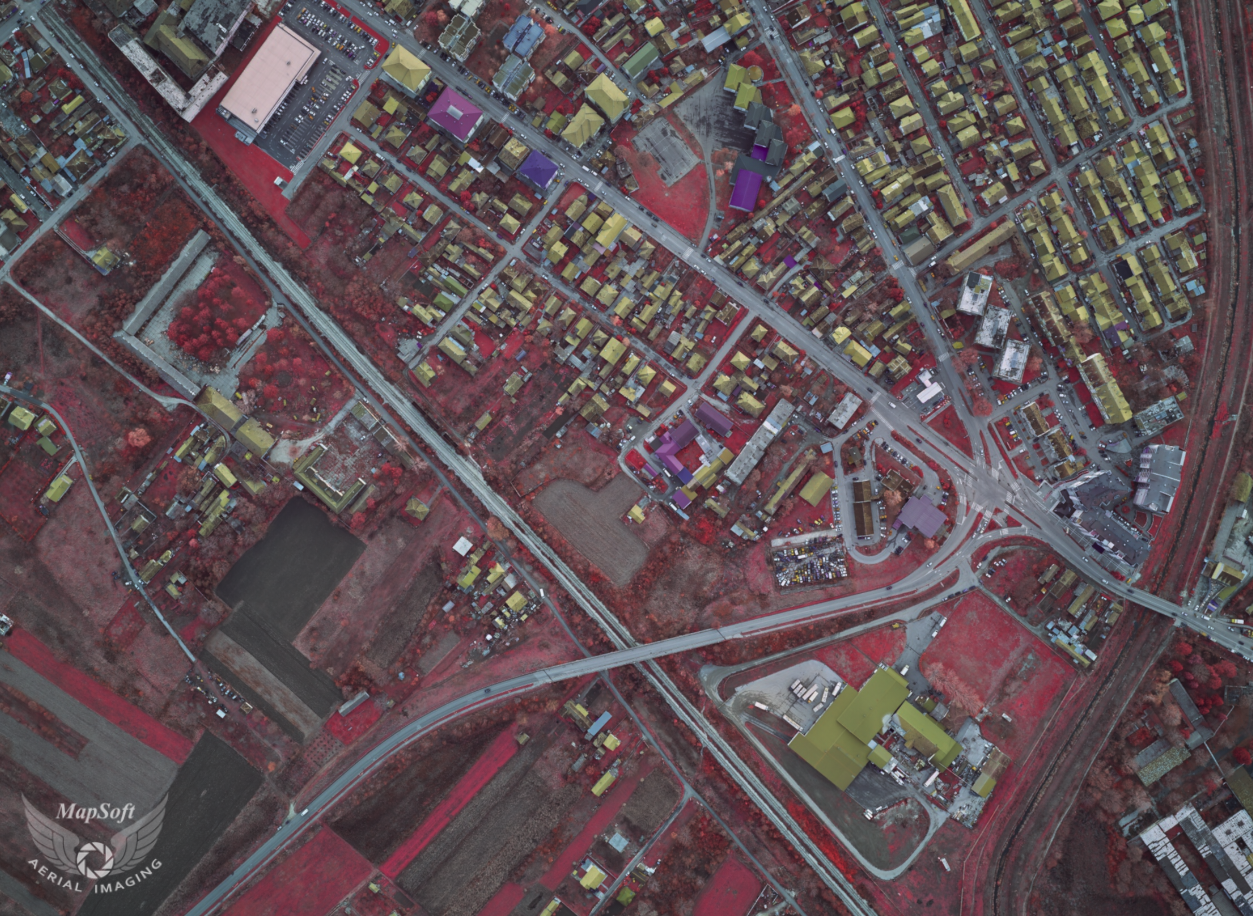
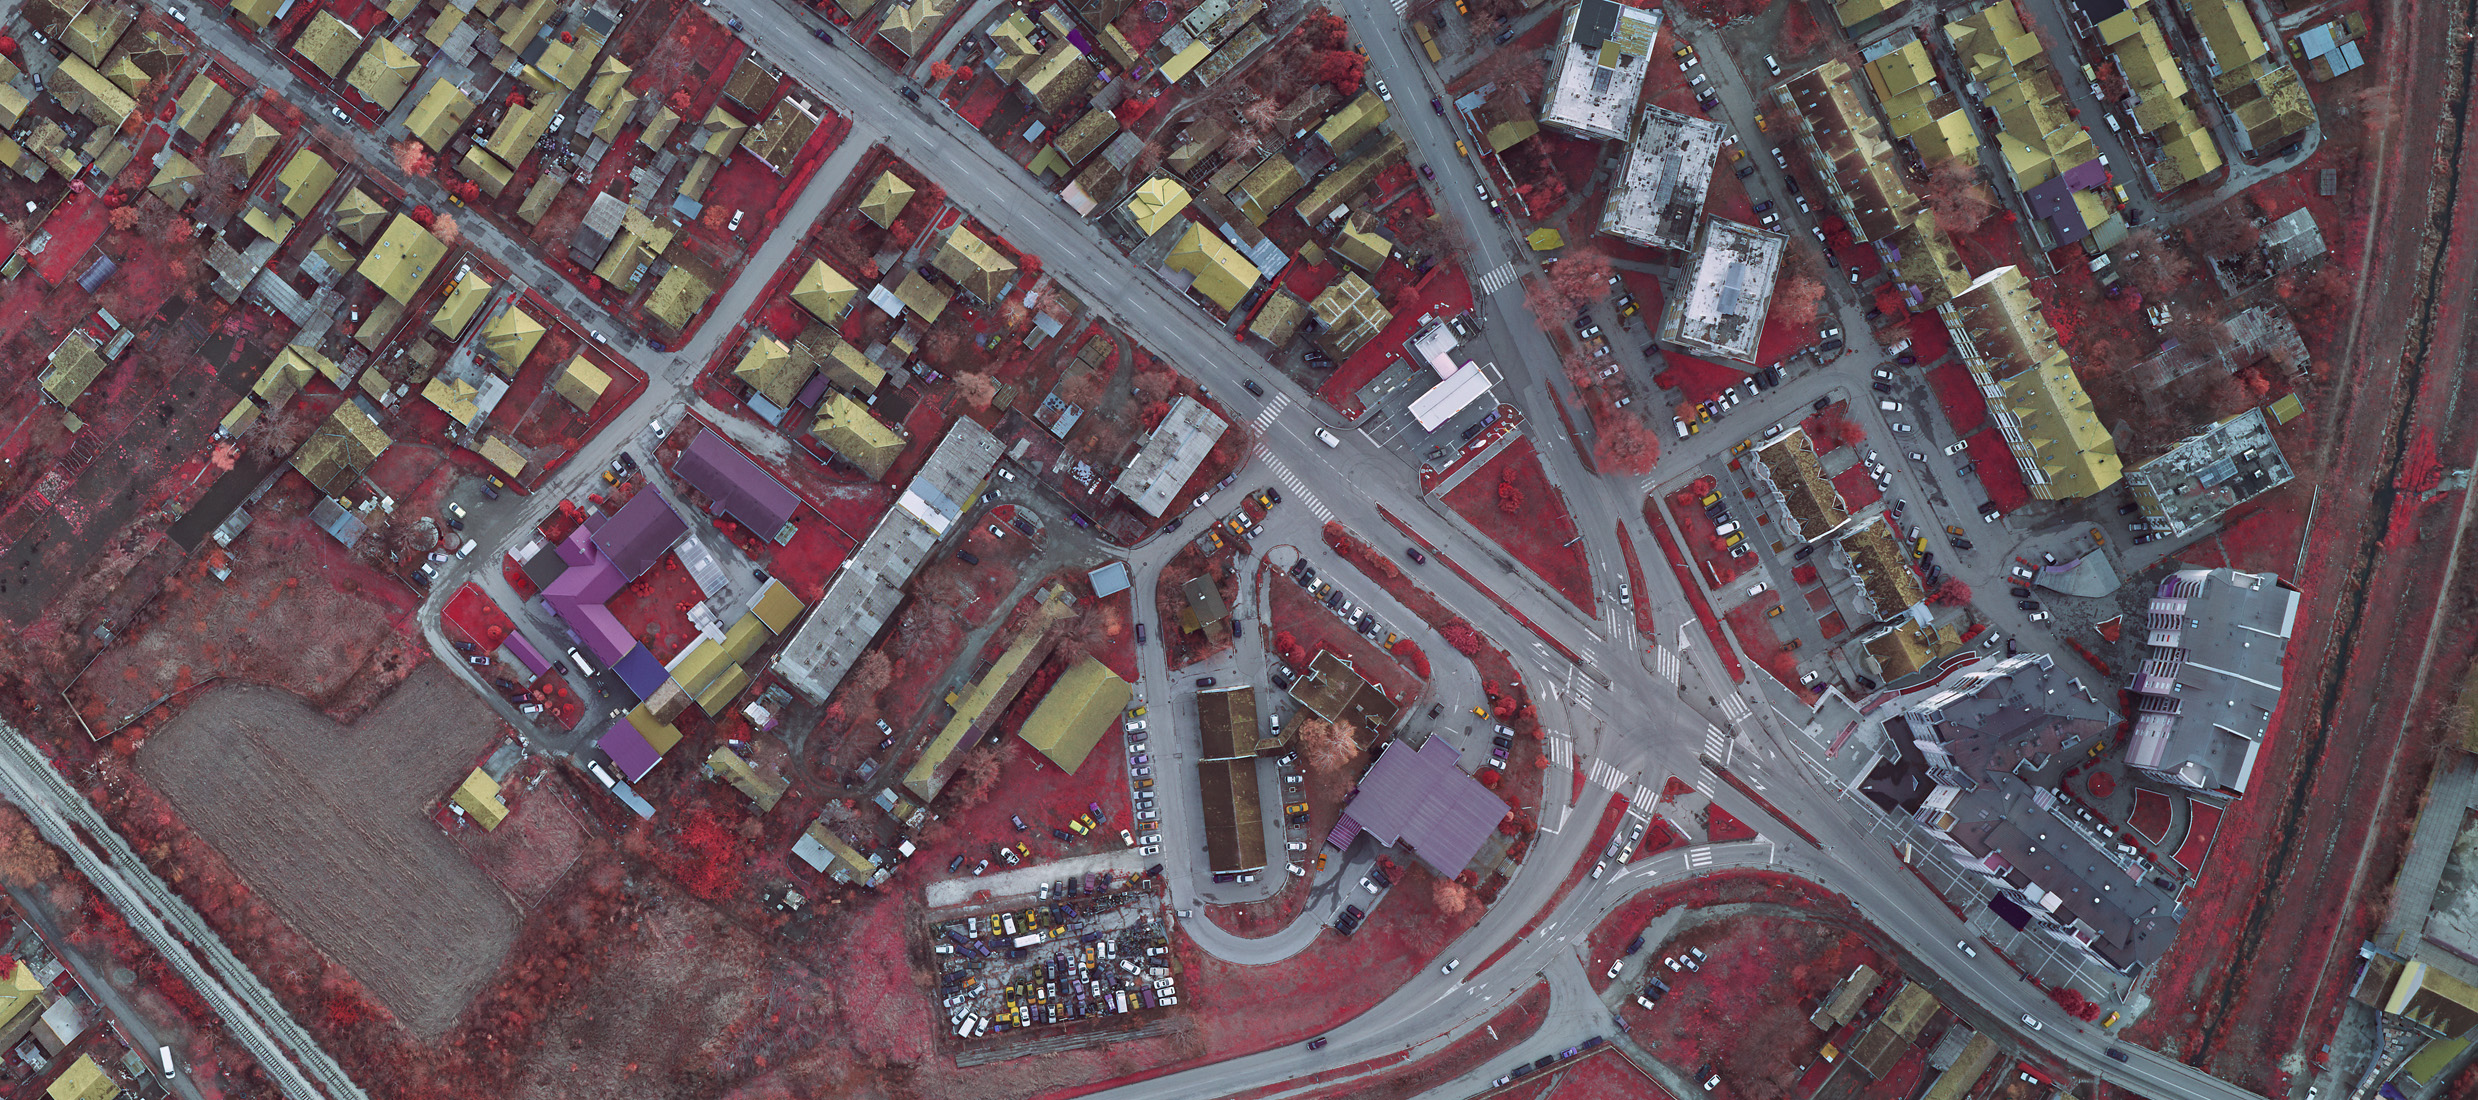
The following is a general summary of what the different colors in CIR aerial imagery represent:
Intense bright red- Bright tones of red typically represent vigorously growing, dense vegetation that is producing a large amount of chlorophyll (See trees and field in the center and right center of the CIR photo at right)
Lighter tones of red, magenta, pinks- These colors generally represent vegetation that does not contain as much chlorophyll such as mature stands of evergreens. Agricultural fields nearing the end of the growing season and dead or unhealthy plants often appear in less intense reds, green, or tan.
White, blue, green, or tan- These colors often represent soils. Darker shades of soil generally indicate higher moisture levels or organic matter. Soil composition also affects soil color appearance, with clayey soils appearing in darker tans and blue-greens, and sandy soils appearing white, gray, or light tan. Crops nearing the end of the growing season, or dead or unhealthy plants will appear in various light tones of red and pink, or greens and tans. Pale or light blue can also represent sediment-laden water. Buildings and man-made materials such as concrete and dry gravel generally appear white to light blue in CIR photos.
Dark blue to black- Water ranges from shades of blue to black depending on the clarity and depth. Usually, the clearer the water, the darker the color. However, shallow streams will often display the colors associated with the materials in their stream beds. If the stream bed is made of sand, the color will appear white or very light tan due to the high reflective property of sand. Asphalt roads generally appear dark blue to black.
NDVI
The NDVI is one of several indexes mentioned in literature dealing with plant health. The Forest Service uses it in assessing wildfire risk. This index is derived from a mathematical normalization technique that utilizes only the red and near-infrared energy measurements.
The NDVI measurement takes into account the amount of red energy that is absorbed by chlorophyll and the amount of near-infrared energy that is reflected by the cellular structure of the leaf (because the red and near infrared measurements are normalized in an indirect measure of vegetation health).
The formula for calculation of NDVI is: (NIR – RED)/ (NIR + RED).
Specification
- Raw images or orthophoto or true orhophoto
- Method of georeferencing: direct georeferencing, aerial triangulation or structure from motion
- Standard raster file formats
- Resolution 2 to 30 cm/pix
- 4 bands (R+G+B+NIR)
- Distortions free image
- 12-bit depth resolution
- Quick response
- Images available few hours after finished flying mission
Applications
- Precision agriculture
- Identifying plant species
- Estimating biomass of vegetation
- Assessing soil moisture
- Assessing water clarity (i.e. turbidity)